Project Introduction:
A Complete End-to-End DevSecOps Kubernetes Implementation Guide: Deploy a Three-Tier Application on AWS EKS with Security Best Practices, Infrastructure as Code, and CI/CD Pipeline Integration.
Project Overview:
This project covers the following key aspects:
- Infrastructure as Code (IaC): Use Terraform to set up the Jenkins server using EC2 instance on AWS.
- IAM User Setup: Create an IAM user on AWS with the necessary permissions to facilitate deployment and management activities.
- Jenkins Server Configuration: Install and configure tools to be used on the Jenkins server – Kubectl, AWS CLI, Docker, Sonarqube, Terraform, Trivy.
- EKS Cluster Deployment: Utilize eksctl commands to create an Amazon EKS cluster, a managed Kubernetes service on AWS.
- Load Balancer Configuration: Configure AWS Application Load Balancer (ALB) for the EKS cluster.
- Amazon ECR Repositories: Create private repositories for both frontend and backend Docker images on Amazon Elastic Container Registry (ECR).
- Data Persistence: Implement persistent volume and persistent volume claims for database pods to ensure data persistence.
- ArgoCD Installation: Install and set up ArgoCD for continuous delivery and GitOps.
- Sonarqube Integration: Integrate Sonarqube for code quality analysis in the DevSecOps pipeline.
- Jenkins Pipelines: Create Jenkins pipelines for deploying backend and frontend code to the EKS cluster.
- DNS Configuration: Configure DNS settings to make the application accessible via custom subdomains.
- ArgoCD Application Deployment: Use ArgoCD to deploy the Three-Tier application, including database, backend, frontend, and ingress components.
- Monitoring Setup: Implement monitoring for the EKS cluster using Helm, Prometheus, and Grafana.
Prerequisites:
- An AWS account with the necessary permissions to create resources.
- Terraform and AWS CLI installed on your local machine.
STEP 1 – CREATE IAM USER and generate Access Key
Create a new IAM User on AWS and give it the AdministratorAccess (This is not recommended for your Organization’s Project, ensure its restrictive and as per the requirement of the project).
Go to the AWS IAM Service and click on Users -> Click on Create user -> Provide a name and click on Next -> Select the “Attach policies directly” option and search for “AdministratorAccess”, then select it -> Click on Next -> Click on Create user.
Select your created user -> Go to Security credentials -> generate access key by clicking on Create access key -> Select the Command Line Interface (CLI) -> select the checkmark for the confirmation and click on Next -> Provide the description and click on the Create access -> You have the access-key now and can download the csv file for future reference.
STEP 2 – Install Terraform & AWS CLI to deploy our Jenkins Server(EC2) on AWS
What we want to do now is to deploy Jenkins server (which also will serve as our Sonarqube server) on AWS using Terraform.
First, we install Terraform and AWS CLI on the local machine.
Terraform Installation Script:
wget -O- https://apt.releases.hashicorp.com/gpg | sudo gpg - dearmor -o /usr/share/keyrings/hashicorp-archive-keyring.gpg
echo "deb [signed-by=/usr/share/keyrings/hashicorp-archive-keyring.gpg] https://apt.releases.hashicorp.com $(lsb_release -cs) main" | sudo tee /etc/apt/sources.list.d/hashicorp.list

sudo apt update
sudo apt install terraform -y
AWSCLI:
curl "https://awscli.amazonaws.com/awscli-exe-linux-x86_64.zip" -o "awscliv2.zip"
sudo apt install unzip -y
unzip awscliv2.zip
sudo ./aws/install
Configure Terraform:
You can either export the environment variables or edit the file /etc/environment in Linux
As I am using Windows, there are a couple of options like:
1. Setting it in System -> environment variables
2. In PowerShell,
$Env:AWS_ACCESS_KEY_ID="YOUR_ACCESS_KEY"
$Env:AWS_SECRET_ACCESS_KEY="YOUR_SECRET_KEY"
$Env:AWS_DEFAULT_REGION="us-west-2"
3. Referencing an existing or new AWS profile in your Terraform configuration, this can be set in the AWS provider block
4. Or just simply exporting it temporarily as I did since I am using VSCode
export AWS_ACCESS_KEY_ID="YOUR_ACCESS_KEY"
export AWS_SECRET_ACCESS_KEY="YOUR_SECRET_KEY"
export AWS_DEFAULT_REGION="us-west-2"
Other options are using .bat, .ps1 and .env to store your keys.
STEP 3 – Deploy the Jenkins Server(EC2) using Terraform
For reference, navigate to Jenkins-Server-TF folder in this Repo:
HereYou can modify backend.tf file such as changing the bucket name and dynamodb table (make sure you have created both manually on AWS Cloud).
terraform {
  backend "s3" {
    bucket         = "my-eksaws-basket1"
    region         = "eu-west-2"
    key            = "End-to-End-Kubernetes-Three-Tier-Project/Jenkins-Server-TF/terraform.tfstate"
    dynamodb_table = "lock-terra"
    encrypt        = true
  }

  required_version = ">=0.13.0"

  required_providers {
    aws = {
      version = ">= 2.7.0"
      source  = "hashicorp/aws"
    }
  }
}
Also do not forget to modify the key-name which represents your SSH key-pair name already created.
Initialize the backend by running the below command:
terraform init
Run the below command to see the AWS services that will be created:
terraform plan -var-file=variables.tfvars
To create the infrastructure on AWS Cloud, run:
terraform apply -var-file=variables.tfvars --auto-approve
After the server starts running, copy the ssh command and paste it on your local machine to login.
Step 4: Configure the Jenkins
We need to validate our installed services (via userdata) as we have installed some services such as Jenkins, Terraform, Kubectl, Docker, Sonarqube, AWS CLI, and Trivy.
We will validate whether all are installed or not:
java --version
docker --version
docker ps
terraform --version
jenkins --version
aws --version
trivy --version
eksctl version
systemctl status jenkins.service
sample output:
ubuntu@ip-10-0-1-22:~$ jenkins --version
2.483

ubuntu@ip-10-0-1-22:~$ docker --version
Docker version 24.0.7, build 24.0.7-0ubuntu2~22.04.1
Now, paste the public IP of the Jenkins Server with port 8080 into the browser:
http://<x.x.x.x>:8080/
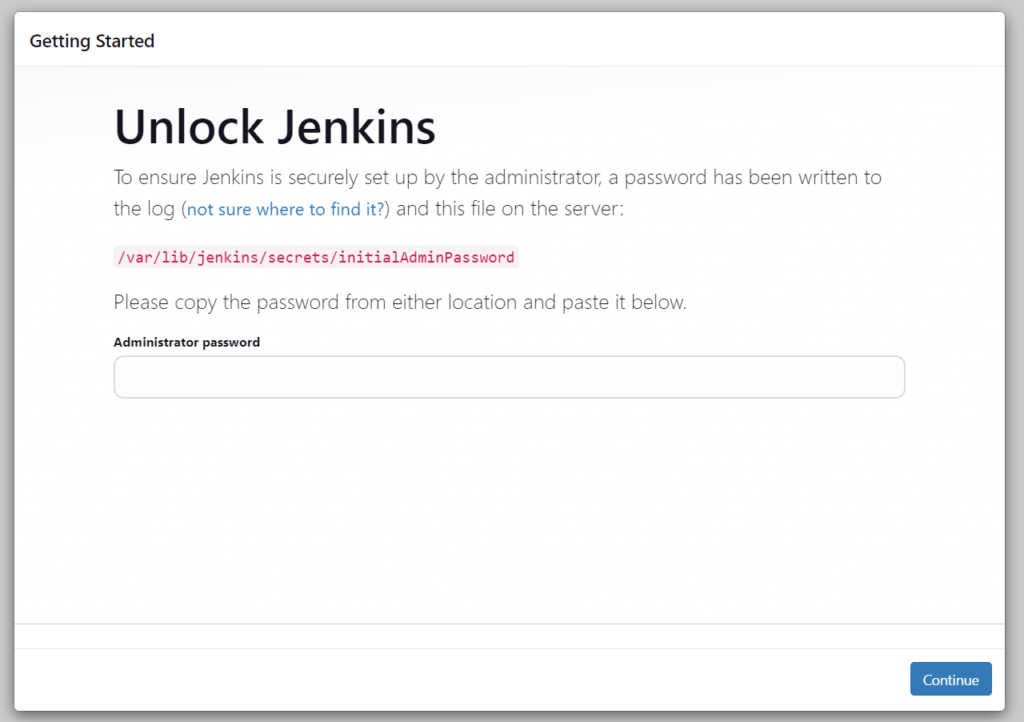
We land on this page where you need to enter the password. If you run “systemctl status jenkins.service”, you can find it in the output, and if you can not, go into the var file path indicated in the Get Started page to retrieve it.

Click on Install suggested plugins => After installing the plugins, continue as admin -> Click on Save and Finish
Step 5: Deploy the EKS Cluster using eksctl commands
On our Jenkins Server terminal, we configure the AWS credentials.
aws configure
AWS Access Key ID [None]: XXXXXXXXXXXXXX
AWS Secret Access Key [None]: XXXXXXXXXXXXXXXXXXXXXXXXXXXXXX
Default region name [None]: eu-west-2
Default output format [None]:
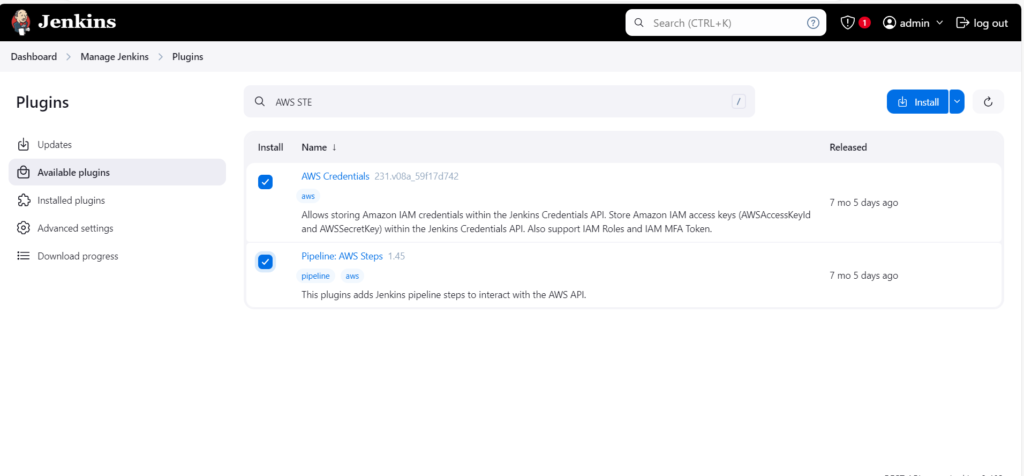
Go to Manage Jenkins -> Click on Plugins -> Install AWS Credentials and Pipeline:AWS Steps
Install both Plugins and check the Restart Jenkins option to restart the Jenkins service.
Login to your Jenkins Server again.
Now, we have to set our AWS credentials on Jenkins -> Go to Manage Jenkins and click on Credentials -> Click on global -> Select AWS Credentials as Kind and add the ID as shown in the below snippet as well as your AWS Access Key & Secret Access key and click on Create.
We need to also add GitHub credentials, add the username and personal access token of your GitHub account (Kind will be “Username with password”).
Install additional Plugins:
Terraform and Pipeline:Stage view
Now we will create our eks cluster:
Before we do this, let us configure our terraform in tools:
Go to Manage Jenkins -> Tools -> terraform installation -> install directory -> Check for where Terraform is installed on the Jenkins server, for example /usr/bin/terraform and paste in the box -> Apply
Now we set up jenkins pipeline to deploy our EKS infrastructure
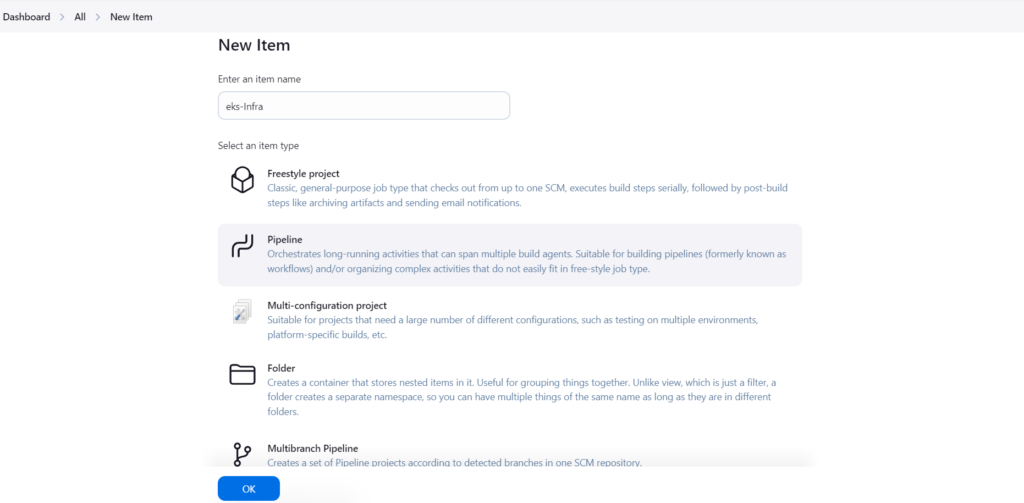
Go to New Item => Enter item name > Select Pipeline > click OK
We will be using
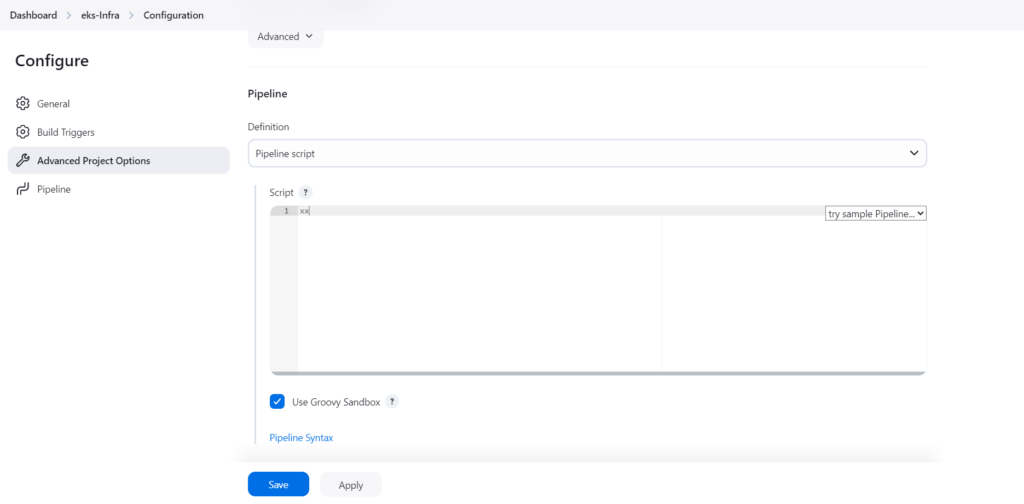
Pipeline script option for this particular project -> copy and paste content of the
Jenkinsfile (from:
this repo ) into the
Script box ->
save ->
Build now

***(Ideally, you should use “pipeline script from SCM”, select Git and connect to GitHub, you have to configure GitHub Webhook or the SCM:Git option to add in your Repository URL and Credentials, this triggers the build automatically upon changes made to the terraform code in GitHub Repo).
As this is a Parametized setup:
Go to => Build with Parameters -> leave it on dev, choose “apply” (it will create VPC first and our private EKS cluster.
We have deployed our EKS Cluster in a private VPC which means it should not be reachable from anywhere outside of its VPC including the Jenkins server which we have used to deploy our infrastructure.
You can validate this with the below commands:
Login to the Jenkin server.
aws eks update-kubeconfig --name dev-medium-eks-cluster --region eu-west-2

kubectl get nodes (You will discover that this times out and its not able to connect to the private eks cluster)
Set up Jump Server in AWS console
Now, let us setup a Jumpserver which we will use to connect to our EKS cluster, we will be setting this up in the console (Note that you can also launch this instance using Terraform).
I have used these specifications:
Ubuntu 22, t2.medium, dev-medium-vpc (already created for our EKS cluster), choose any of the public subnet, leave Security Group as default – it will create a new one, 30GB, Select IAM profile, userdata (need to install some components on Jumpserver such as aws cli, kubectl, helm, eksctl)
Paste the below into the userdata box before creating instance.
#!/bin/sh
# Installing AWS CLI
curl "https://awscli.amazonaws.com/awscli-exe-linux-x86_64.zip" -o "awscliv2.zip"
sudo apt install unzip -y
unzip awscliv2.zip
sudo ./aws/install

# Installing Kubectl
#!/bin/bash
sudo apt update
sudo apt install curl -y
sudo curl -LO "https://dl.k8s.io/release/v1.28.4/bin/linux/amd64/kubectl"
sudo chmod +x kubectl
sudo mv kubectl /usr/local/bin/
kubectl version --client

# Intalling Helm
sudo snap install helm --classic

# Installing eksctl
curl --silent --location "https://github.com/weaveworks/eksctl/releases/latest/download/eksctl_$(uname -s)_amd64.tar.gz" | tar xz -C /tmp
sudo mv /tmp/eksctl /usr/local/bin
eksctl version
Login to the Jumpserver to validate what was installed:
aws --version
kubectl version
eksctl
helm
aws configure (use iam role or configure your keys)
We are going to go ahead to check our EKS Cluster infra deployment from AWS console and via Jumpserver.
We can see that our cluster is present, OpenID is already created, check out the Kubernetes version and all the resources and nodes.
Via Jumpserver:
    aws eks update-kubeconfig --name dev-medium-eks-cluster --region eu-west-2

    kubectl get nodes

ubuntu@ip-10-16-7-171:~$ kubectl get nodes
NAME                                          STATUS   ROLES    AGE   VERSION
ip-10-16-134-244.eu-west-2.compute.internal   Ready    <none>   64m   v1.29.8-eks-a737599
ip-10-16-146-155.eu-west-2.compute.internal   Ready    <none>   64m   v1.29.8-eks-a737599
Step 6: Configure the Load Balancer on our EKS because our application will have an ingress controller.
As prerequisite, download the policy for the LoadBalancer:
curl -O https://raw.githubusercontent.com/kubernetes-sigs/aws-load-balancer-controller/v2.5.4/docs/install/iam_policy.json
Create the IAM policy using the below command:
aws iam create-policy --policy-name AWSLoadBalancerControllerIAMPolicy --policy-document file://iam_policy.json
No need to create OIDC Provider (already done by terraform script if you are using this guide), otherwise, you can run the command below:
eksctl utils associate-iam-oidc-provider --region=eu-west-2 --cluster=dev-medium-eks-cluster --approve
Create a Service Account by using below command and replace your account ID with yours:
eksctl create iamserviceaccount --cluster=dev-medium-eks-cluster --namespace=kube-system --name=aws-load-balancer-controller --role-name AmazonEKSLoadBalancerControllerRole --attach-policy-arn=arn:aws:iam::<your_account_id>:policy/AWSLoadBalancerControllerIAMPolicy --approve --region=eu-west-2
In preparation for the deployment of our LB Controller, install helm repo for EKS:
helm repo add eks https://aws.github.io/eks-charts
helm repo update eks
helm repo list
To deploy the AWS Load Balancer Controller, run the below command:
helm install aws-load-balancer-controller eks/aws-load-balancer-controller -n kube-system --set clusterName=dev-medium-eks-cluster --set serviceAccount.create=false --set serviceAccount.name=aws-load-balancer-controller
After some minutes, run the command below to check whether the pods are running or not.
kubectl get deployment -n kube-system aws-load-balancer-controller

ubuntu@ip-10-16-7-171:~$ kubectl get deployment -n kube-system aws-load-balancer-controller
NAME                           READY   UP-TO-DATE   AVAILABLE   AGE
aws-load-balancer-controller   2/2     2            2           25s
Step 7: Install & Configure ArgoCD (For automation – you can use terraform)
Using the jumpserver,
Create namespace for ArgoCD:
kubectl create namespace argocd
Apply the argocd configuration for installation:
kubectl apply -n argocd -f https://raw.githubusercontent.com/argoproj/argo-cd/v2.4.7/manifests/install.yaml
Do some checks:
kubectl get all -n argocd
ubuntu@ip-10-16-7-171:~$ kubectl get all -n argocd
NAME                                                    READY   STATUS    RESTARTS   AGE
pod/argocd-application-controller-0                     1/1     Running   0          83s
pod/argocd-applicationset-controller-749957bcc9-c7rmm   1/1     Running   0          84s
pod/argocd-dex-server-868bf8bc97-l82xf                  1/1     Running   0          84s
pod/argocd-notifications-controller-5fff689764-2lksh    1/1     Running   0          84s
pod/argocd-redis-fb66447b8-zrltp                        1/1     Running   0          83s
pod/argocd-repo-server-794b8857ff-km7t5                 1/1     Running   0          83s
pod/argocd-server-7bc9d78cf4-qvz8c                      1/1     Running   0          83s

NAME                                              TYPE        CLUSTER-IP       EXTERNAL-IP   PORT(S)                      AGE
service/argocd-applicationset-controller          ClusterIP   172.20.181.80    <none>        7000/TCP,8080/TCP            84s
service/argocd-dex-server                         ClusterIP   172.20.11.31     <none>        5556/TCP,5557/TCP,5558/TCP   84s
service/argocd-metrics                            ClusterIP   172.20.229.136   <none>        8082/TCP                     84s
service/argocd-notifications-controller-metrics   ClusterIP   172.20.70.39     <none>        9001/TCP                     84s
service/argocd-redis                              ClusterIP   172.20.247.215   <none>        6379/TCP                     84s
service/argocd-repo-server                        ClusterIP   172.20.28.141    <none>        8081/TCP,8084/TCP            84s
service/argocd-server                             ClusterIP   172.20.55.126    <none>        80/TCP,443/TCP               84s
service/argocd-server-metrics                     ClusterIP   172.20.194.124   <none>        8083/TCP                     84s

NAME                                               READY   UP-TO-DATE   AVAILABLE   AGE
deployment.apps/argocd-applicationset-controller   1/1     1            1           84s
deployment.apps/argocd-dex-server                  1/1     1            1           84s
deployment.apps/argocd-notifications-controller    1/1     1            1           84s
deployment.apps/argocd-redis                       1/1     1            1           84s
deployment.apps/argocd-repo-server                 1/1     1            1           84s
deployment.apps/argocd-server                      1/1     1            1           84s

NAME                                                          DESIRED   CURRENT   READY   AGE
replicaset.apps/argocd-applicationset-controller-749957bcc9   1         1         1       84s
replicaset.apps/argocd-dex-server-868bf8bc97                  1         1         1       84s
replicaset.apps/argocd-notifications-controller-5fff689764    1         1         1       84s
replicaset.apps/argocd-redis-fb66447b8                        1         1         1       84s
replicaset.apps/argocd-repo-server-794b8857ff                 1         1         1       84s
replicaset.apps/argocd-server-7bc9d78cf4                      1         1         1       83s

NAME                                             READY   AGE
statefulset.apps/argocd-application-controller   1/1     83s
kubectl get svc -n argocd

ubuntu@ip-10-16-7-171:~$ kubectl get svc -n argocd
NAME                                      TYPE        CLUSTER-IP       EXTERNAL-IP   PORT(S)                      AGE
argocd-applicationset-controller          ClusterIP   172.20.181.80    <none>        7000/TCP,8080/TCP            2m25s
argocd-dex-server                         ClusterIP   172.20.11.31     <none>        5556/TCP,5557/TCP,5558/TCP   2m25s
argocd-metrics                            ClusterIP   172.20.229.136   <none>        8082/TCP                     2m25s
argocd-notifications-controller-metrics   ClusterIP   172.20.70.39     <none>        9001/TCP                     2m25s
argocd-redis                              ClusterIP   172.20.247.215   <none>        6379/TCP                     2m25s
argocd-repo-server                        ClusterIP   172.20.28.141    <none>        8081/TCP,8084/TCP            2m25s

argocd-server                             ClusterIP   172.20.55.126    <none>        80/TCP,443/TCP               2m25s
argocd-server-metrics                     ClusterIP   172.20.194.124   <none>        8083/TCP                     2m25s
We are going to modify our argocd-server service:
kubectl edit svc argocd-server -n argocd
change type: ClusterIP to type: LoadBalancer
Validate that all pods are running:
kubectl get pods -n argocd
To confirm LoadBalancer has been created, visit AWS Console and navigate to LoadBalancer (under ec2).
To access the ArgoCD, copy the LoadBalancer DNS address and enter it in your browser, you should see the ArgoCD login page.
For Username, use admin; for Password, this needs fetching from secrets.
To fetch the secret:
kubectl get secrets -n argocd

kubectl edit secret argocd-initial-admin-secret -n argocd
What we need is data:<password>, we need to decode the password:
echo <password> | base64 --decode

Step 8: Create Amazon ECR Private Repositories for both Tiers (Frontend & Backend)
From AWS Console, navigate to ECR, Click on Create repository, add Repository name – “frontend” and click on create.
Do the same for “backend”.
Now, we have set up our ECR Private Repository, we will be uploading our images to Amazon ECR.
We need to add these Repo names in
Jenkins as
secret texts.
In Jenkins – Go to
Manage Jenkins >
Credential >
global >
Add Credentials > Kind:
Secret text > for Secret, input –
frontend and ID will be
ECR_REPO_1
Do similar for the backend:
for Secret, input –
backend; ID will be
ECR_REPO2
Note: Also ensure your GitHub username and password (PAT token) is present in credentials, this is to push and update the image tag number by Jenkins to our Github Repo.
Step 9: Configure Sonarqube for our DevSecOps Pipeline
Since we are using same server for both Jenkins and Sonarqube, copy your Jenkins Server public IP and paste it on your browser with a 9000 port.
The username and password will be admin.
Update the password.
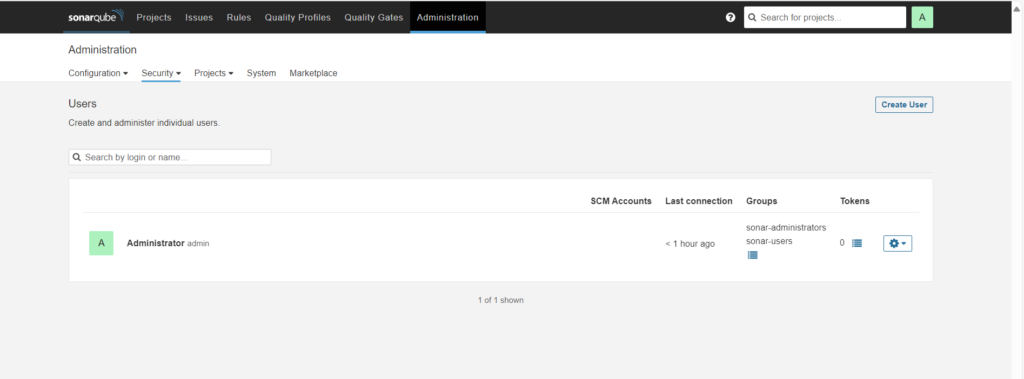
Click on Administration then Security, and select Users.
Click on Update tokens, give token name.
Copy the token, keep it somewhere safe and click on Done.
Now, we have to configure webhooks for quality checks.
Go to Administration -> Configuration -> select Webhooks (Jenkins will be the external service that will be notified) -> create Name: jenkins; URL: http://<jenkins-ip>:8080/sonarqube-webhook/; Secret: no-need.
We can see the webhook below.

Now, we have to create a Project for frontend code.
Go to Projects => Click on Manually -> Provide the display name to your Project and click on Setup
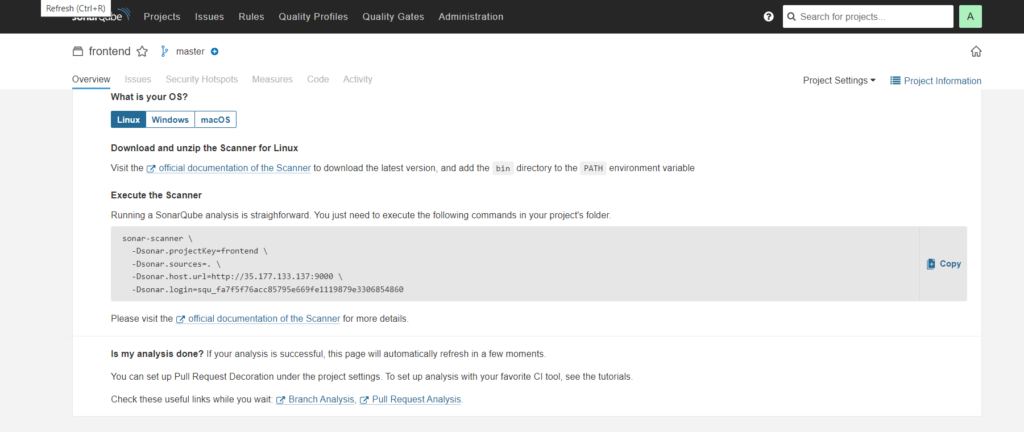
display-name: frontend, project-key: frontend; main-branch-name: main -> setup -> Click locally -> use existing token (Paste the key which you have set aside) -> Select Other and Linux as OS
After performing the above steps, you will get the command which you can see in the below snippet.

Now, use the command in the Jenkins Frontend Pipeline where Code Quality Analysis will be performed.
Now, we have to create a Project for backend code.
Click on Create Project -> Manually -> Provide the display name (backend) to your Project and click on Setup
Click locally -> use existing token and click on Continue > Select Other and Linux as OS
You will get a command, we use the command in the Jenkins Backend Pipeline where Code Quality Analysis will be performed.
Now, we have to store the sonar credentials in Jenkins.
Go to Dashboard -> Manage Jenkins -> Credentials
Select the kind as Secret text, paste your token in Secret and configure ID as sonar-token, click on Create.
Configure additional credentials on Jenkins – GitHub credentials
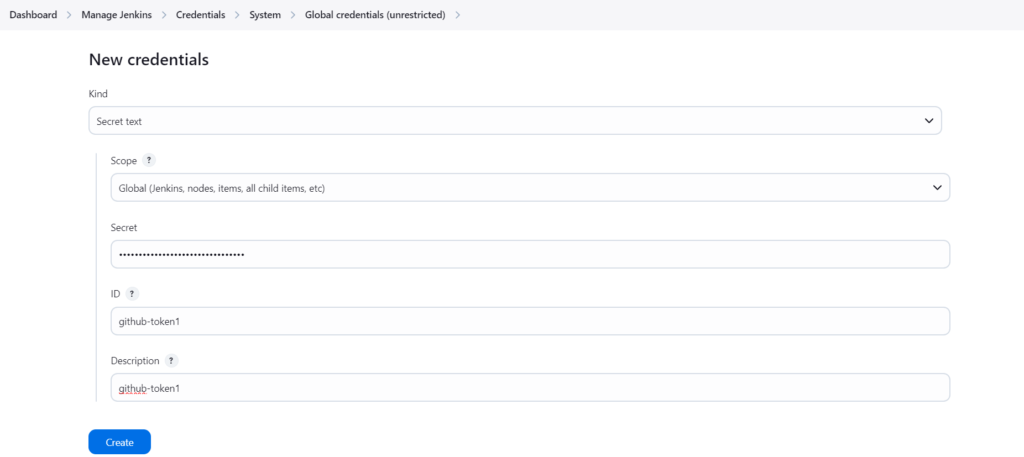
Now, if you haven’t stored your GitHub Personal access token, do that now as we need to push the deployment file which will be modified in the pipeline itself for the ECR image.
Select the kind as Secret text and paste your GitHub Personal access token(PAT) in Secret, ID as github-token.
Click on Create.

Now, according to our Pipeline, we need to add an Account ID in the Jenkins credentials because of the ECR repo URI.
Select kind as Secret text, paste your AWS Account ID in Secret, ID as ACCOUNT_ID.
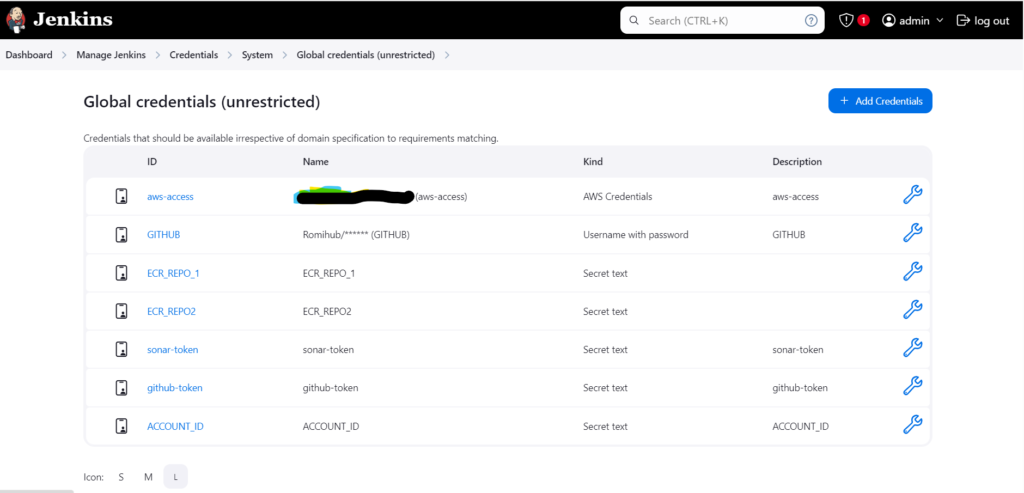
Snapshot of all Credentials that we have added so far:
Step 10: Install the required plugins and configure the plugins to deploy our Three-Tier Application
We need to install additional plugins in Jenkins.
Docker
Docker Pipeline
Docker Commons
Docker API
docker-build-step
Nodejs
SonarQube Scanner
OWASP Dependency-Check
Go To Dashboard -> Manage Jenkins -> Plugins -> Available Plugins > Install

Now, we have to configure the installed plugins.
Go to Dashboard -> Manage Jenkins -> Tools
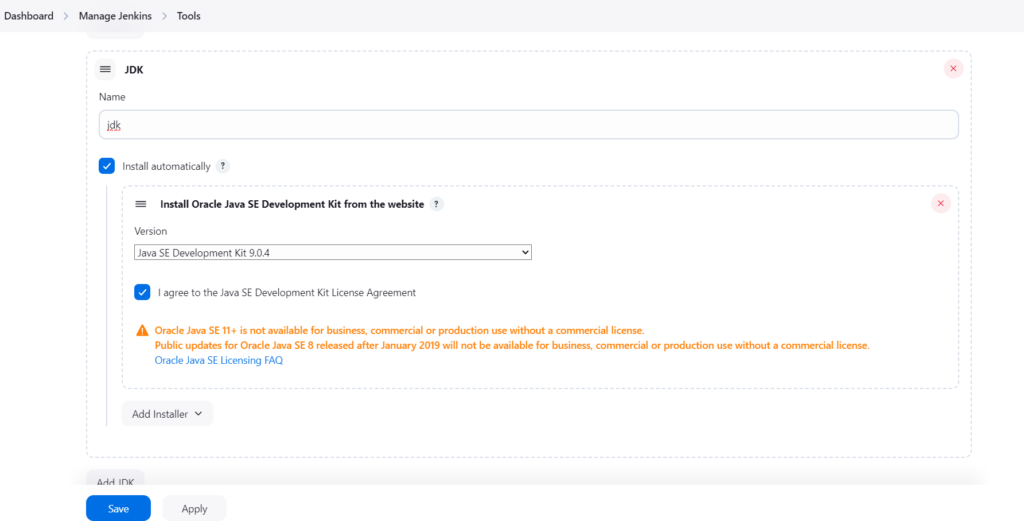
Search for each of the following tools – jdk, sonarqube scanner,Nodejs, Dependency-Check (select “Install from github.com”)
Give a Name and select Install automatically as shown for jdk and sonarqube scanner below as examples.

Now, we have to set the path for Sonarqube in Jenkins
Go to Dashboard -> Manage Jenkins -> System -> Search for SonarQube installations
Provide the name as below, then in the Server URL copy the Sonarqube public IP (same as Jenkins) with port 9000 select the sonar token that we previously created in credentials, and click on Save.

Deploy Backend
Now, we are ready to create our Jenkins Pipeline to deploy our Backend Code.
Go to Jenkins Dashboard -> Click on New Item -> Provide the name of your Pipeline -> Select Pipeline -> click on OK.
Here is the Jenkins file to deploy the Backend Code on EKS, copy and paste it into the Jenkins.
Select Pipeline script, paste it in and save.
Note: Make changes in the Pipeline according to your project.
Click on Build Now.
Our Backend pipeline was successful….after a few common mistakes and errors.

Deploy Frontend
To create our Jenkins Pipeline to deploy our Frontend Code.
Go to Jenkins Dashboard -> Click on New Item -> Provide the name of your Pipeline -> Select Pipeline -> click on OK.
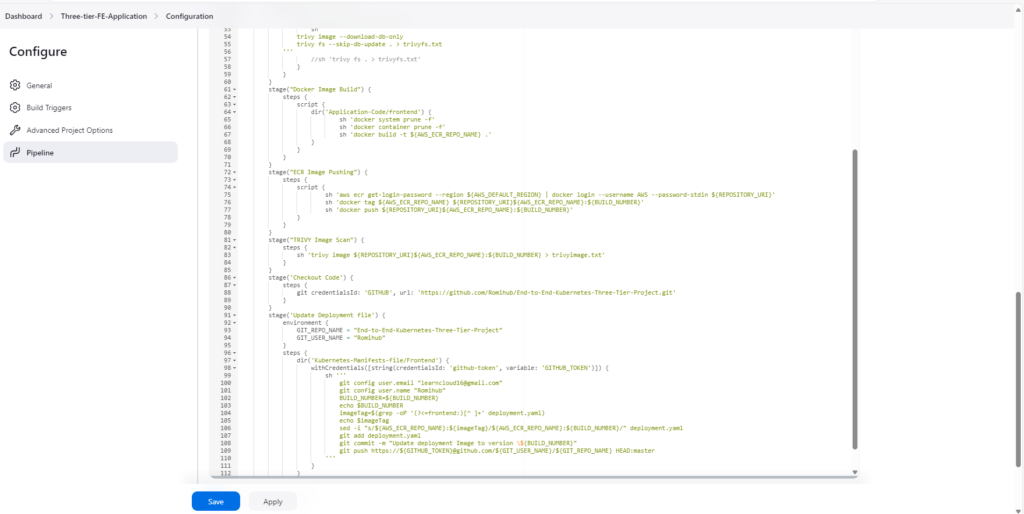
Here is the Jenkins file to deploy the Frontend Code on EKS, copy and paste it into the Jenkins.
Select Pipeline script, paste it in and save.
Note: Make changes in the Pipeline according to your project.

Click on the Build Now.
Our Frontend pipeline was successful ……after a few common mistakes and errors.

After pipelines have finished running for both Frontend and Backend,
Sonarqube -> Projects -> Frontend and Backend
ECR for the Frontend and Backend Image.
Step 11: We will deploy our Three-Tier Application using ArgoCD
Connect ArgoCD to your repository:
Go to Repositories -> connect repo using https -> Enter the below details:
type: git
Project: default
repository url – https://github.com/Romihub/End-to-End-Kubernetes-Three-Tier-Project.git
username/password : not required unless its a private repo
Prior to adding the applications, Go back to Jumpserver to create our namespace:
kubectl create ns three-tier
Now we configure our applications (Modify for your own repo and Path or you can use this):
We will create database first, then create a backend application and then a frontend application.
Database
Go to Application -> New App -> Configure:
Application-name: three-tier-database;
project-name: default;
SYNC POLICY: Automatic;
self-heal is checked;
Add repository url: <Your Repo URL>;
Revision: HEAD;
Path: Kubernetes-Manifests-file/Database;
DESTINATION/Cluster URL: https://kubernetes.default.svc;
namespace: three-tier —> Create
Do basic checks:
    kubectl get all -n three-tier

    kubectl get pvc -n three-tier
Backend
NEW APP ==>
Application-name: three-tier-backend;
project-name: default;
SYNC POLICY: Automatic;
self-heal is checked;
Add repository url: <Your Repo URL>;
Revision: HEAD will remain;
Path: Kubernetes-Manifests-file/Backend;
DESTINATION/Cluster URL: https://kubernetes.default.svc;
namespace: three-tier ->
Create
Frontend
NEW APP ==>
Application-name: three-tier-frontend;
project-name: default;
SYNC POLICY: Automatic;
self-heal is checked;
Add repository url: <Your Repo URL>;
Revision: HEAD will remain;
Path: Kubernetes-Manifests-file/Frontend;
DESTINATION/Cluster URL: https://kubernetes.default.svc;
namespace: three-tier –>
Create
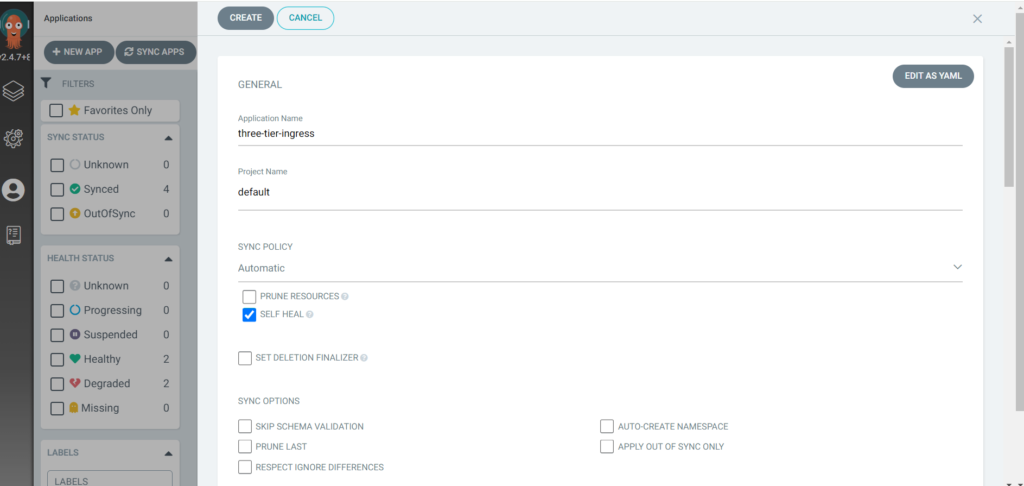
INGRESS
We will create an application for the ingress.
Go to Application ==> NEW APP ->
Application-name: three-tier-ingress;
project-name: default;
SYNC POLICY: Automatic;
self-heal is checked;
Add repository URL: <Your Repo URL>;
Revision: HEAD will remain;
Path: Kubernetes-Manifests-file/;
DESTINATION/Cluster URL: https://kubernetes.default.svc;
namespace: three-tier ->
Create


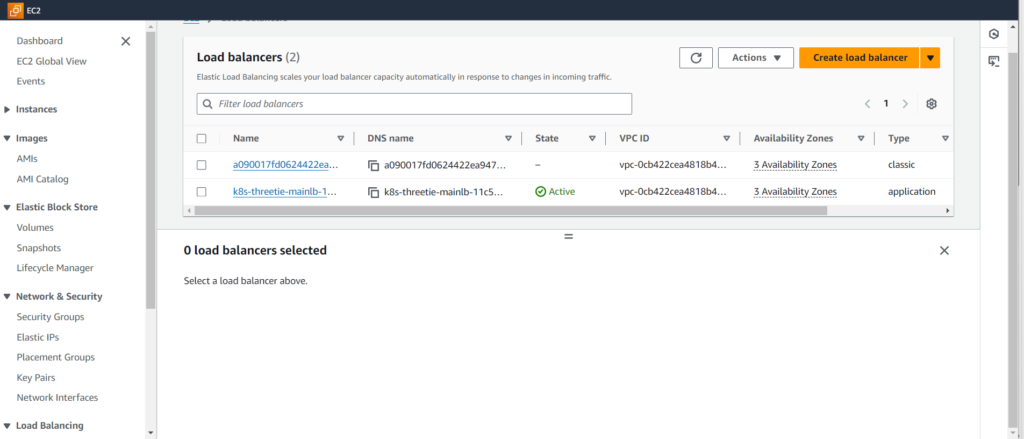
Once your Ingress application is deployed. It will create an Application Load Balancer.
You can check out the load balancer named with k8s-three in AWS Console.

Also check on ArgoCD the status of your ingress App by going to App details and App diff.
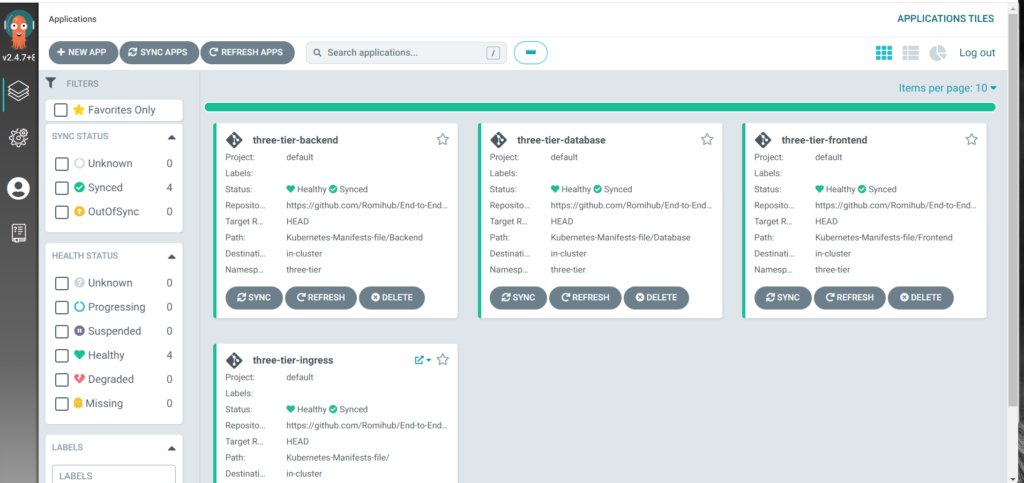
You can now see all 4 application deployments synced and healthy in the below snapshot:

Route53 (Short guide below for your DNS Record)
Go to Hosted zone,
Add your ingress domain (Go and add AWS name servers to your hosted domain at the provider end such as godaddy..).
After your ingress application is deployed,
Create record -> Record name: yoursitedomain.com; Record-type: A record; Route traffic to: Alias to Application and Classic Load Balancer; Region: <your choice of region>; Select your LoadBalancer -> Create records.
Let’s get back to our checks:
kubectl get all -n three-tier
kubectl get ing -n three-tier
ubuntu@ip-10-16-7-171:~$ kubectl get all -n three-tier
NAME                           READY   STATUS    RESTARTS   AGE
pod/api-d97778984-cdj47        1/1     Running   0          27m
pod/api-d97778984-mcfx5        1/1     Running   0          27m
pod/frontend-5f85bcc6d-xcp94   1/1     Running   0          19m
pod/mongodb-59797b688c-l9tmz   1/1     Running   0          14h

NAME                  TYPE        CLUSTER-IP       EXTERNAL-IP   PORT(S)     AGE
service/api           ClusterIP   172.20.66.65     <none>        3500/TCP    14h
service/frontend      ClusterIP   172.20.227.180   <none>        3000/TCP    14h
service/mongodb-svc   ClusterIP   172.20.227.39    <none>        27017/TCP   14h

NAME                       READY   UP-TO-DATE   AVAILABLE   AGE
deployment.apps/api        2/2     2            2           14h
deployment.apps/frontend   1/1     1            1           14h
deployment.apps/mongodb    1/1     1            1           14h

NAME                                  DESIRED   CURRENT   READY   AGE
replicaset.apps/api-679d8f887d        0         0         0       84m
replicaset.apps/api-86759c4cdf        0         0         0       14h
replicaset.apps/api-d97778984         2         2         2       27m
replicaset.apps/frontend-5884cd6448   0         0         0       84m
replicaset.apps/frontend-5f85bcc6d    1         1         1       19m
replicaset.apps/frontend-845779f6db   0         0         0       14h
replicaset.apps/mongodb-59797b688c    1         1         1       14h
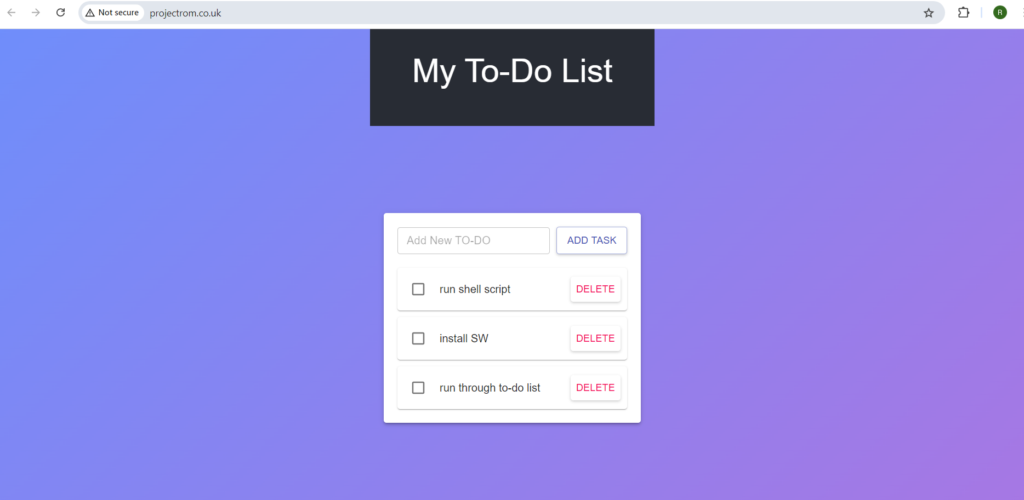
Now enter your domain after 2 to 3 minutes in your browser, our app is up and running.
You can play around with the application by adding and deleting records.

Step 12: Set up the Monitoring for our EKS Cluster – Prometheus and Grafana
We will be using Helm. Connect to Jump server.
Add the Prometheus repo by using the below command:
helm repo add stable https://charts.helm.sh/stable
Install the Prometheus
helm repo add prometheus-community https://prometheus-community.github.io/helm-charts
helm repo list (for checks)
helm install prometheus prometheus-community/prometheus

kubectl get all
(Prometheus was deployed in the default NS)
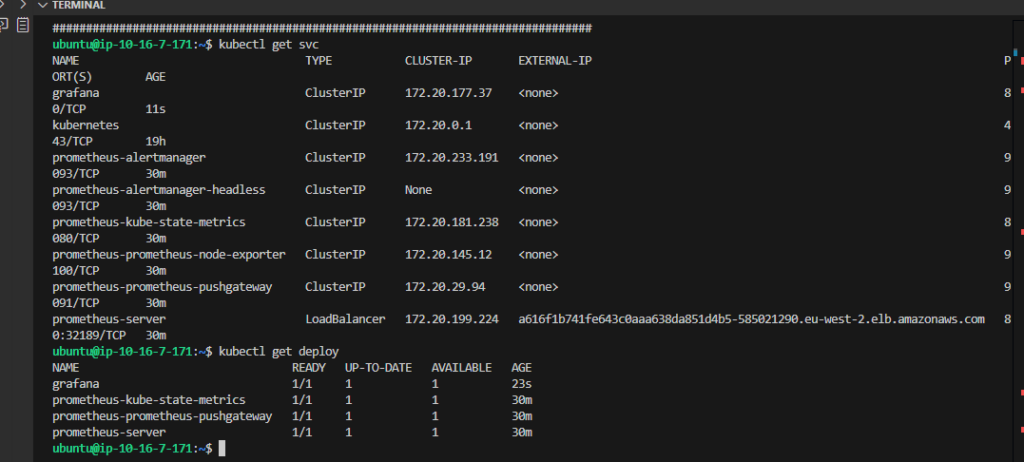
Check the service with the below command:
kubectl get svc

kubectl get deploy
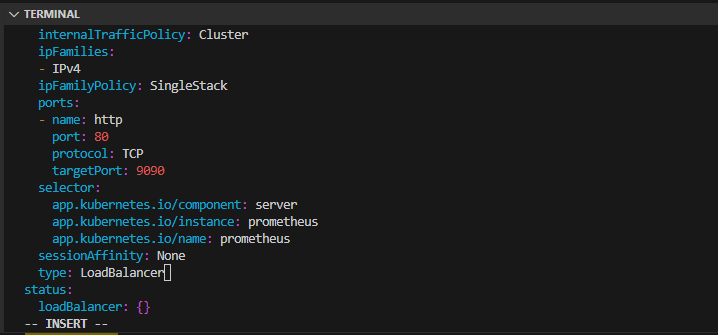
We need to expose our Prometheus server to outside of the cluster, so we will change the Service type from ClusterType to LoadBalancer.
kubectl edit svc prometheus-server (change: type: ClusterIP to LoadBalancer)

kubectl get svc prometheus-server
You can also validate from AWS console.
Paste the <Prometheus-LB-DNS> in your browser and you will see the dashboard.

Click on Status and select Target, you will see a lot of Targets:
Install the Grafana
helm repo add grafana https://grafana.github.io/helm-charts
helm repo update
helm install grafana grafana/grafana
We will be using Prometheus as a data source (meanwhile one can also use alert manager in Prometheus).
kubectl get all
kubectl get svc

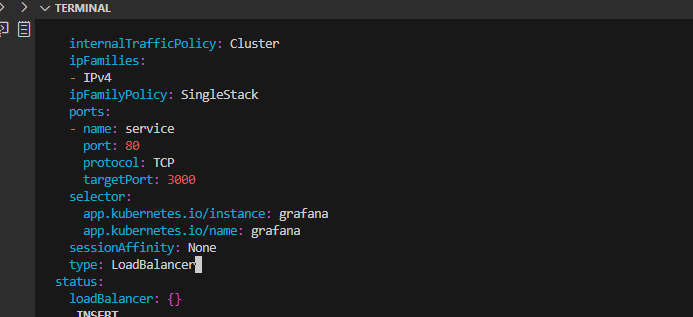
We need to expose our Grafana to outside of the cluster, so we will change the Service type from ClusterType to LoadBalancer.
Edit the Grafana service:
kubectl edit svc grafana

Note: In an organization setting, you will have domain name for both Prometheus and Grafana
If you list the service again, you will see the LoadBalancers’ DNS names.
kubectl get svc

Let’s check all our pods as well:
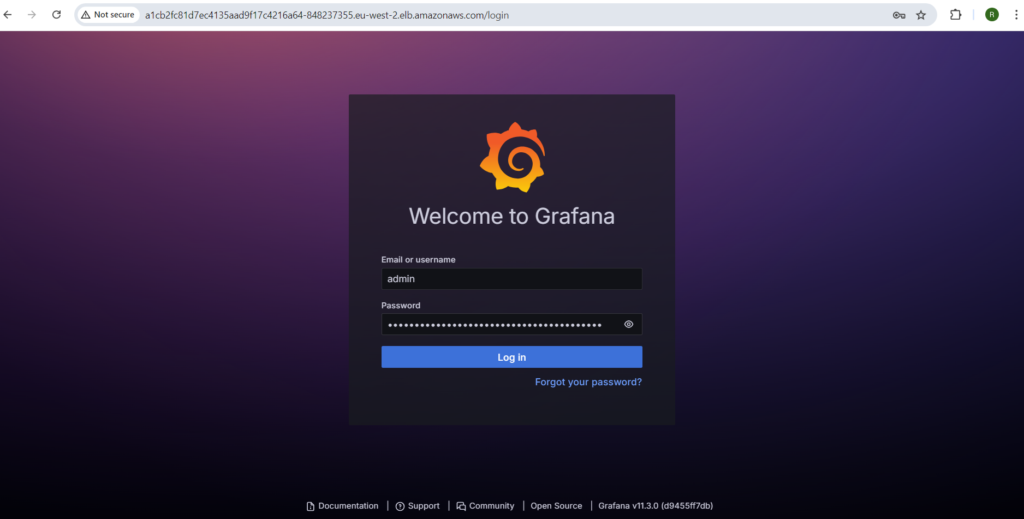
Now, access your Grafana Dashboard.
Copy the ALB DNS of Grafana and paste it into your browser.
The username will be admin and for the password, we will need to fetch it from secrets.
kubectl get secrets

kubectl edit secrets grafana
Get the admin-password and decode it.
OR simply run the below command:
kubectl get secret --namespace default grafana -o jsonpath="{.data.admin-password}" | base64 --decode ; echo

Now, click on
Data Sources -> Select
Prometheus -> In the Connection, paste your
<Prometheus-LB-DNS>.
If the URL is correct, then you will see a green notification -> Click on Save & test.
We will now create a dashboard to visualize our Kubernetes Cluster Logs.
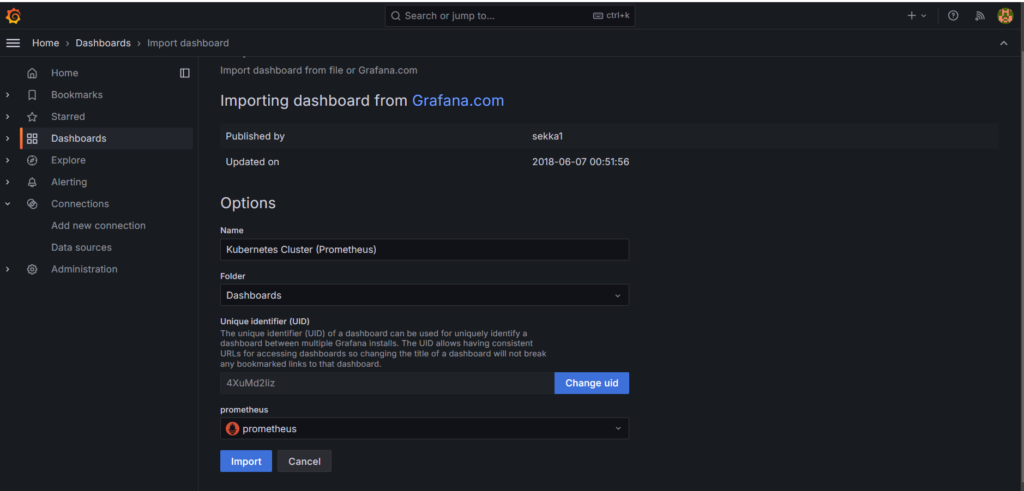
Click on Dashboard, we will try to import a type of Kubernetes Dashboard.
Click on New and select Import -> Provide 6417 ID and click on Load.
Note: 6417 is a unique ID from Grafana which is used to Monitor and visualize Kubernetes Data.
Select the data source that you have created earlier and click on Import.
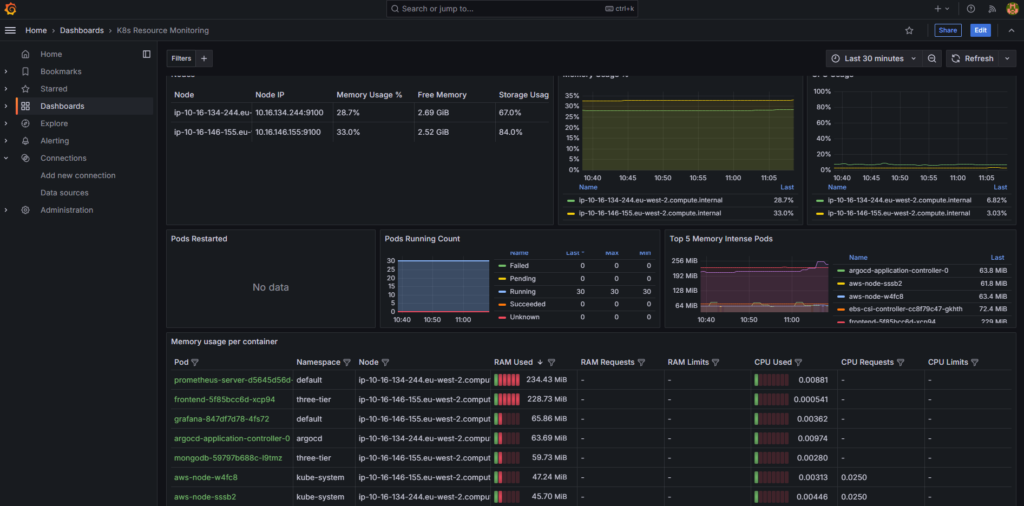
Now, you can view your Kubernetes Cluster Data.

Try to import another dashboard using unique ID 17375.
Please note that you can also have your own customized dashboards.
ERROR ENCOUNTERED DURING PIPELINE BUILD FOR Trivy
I was getting the below error for trivy scan.
+ trivy fs .
2024-10-31T07:39:38Z INFO [vulndb] Need to update DB
2024-10-31T07:39:38Z INFO [vulndb] Downloading vulnerability DB…
2024-10-31T07:39:38Z INFO [vulndb] Downloading artifact… repo=”ghcr.io/aquasecurity/trivy-db:2″
2024-10-31T07:39:38Z ERROR [vulndb] Failed to download artifact repo=”ghcr.io/aquasecurity/trivy-db:2″ err=”oci download error: failed to fetch the layer: GET https://ghcr.io/v2/aquasecurity/trivy-db/blobs/sha256:ba0d01953a8c28331552412292b72f3639b3962fe27f3359a51553a52d3f7b29: TOOMANYREQUESTS: retry-after: 1.237243ms, allowed: 44000/minute”
2024-10-31T07:39:38Z FATAL Fatal error init error: DB error: failed to download vulnerability DB: OCI artifact error: failed to download vulnerability DB: failed to download artifact from any source
I have temporarily set it to offline scanning while I search for other reliable solutions to it.
   stage('Trivy File Scan') {
            steps {
                dir('Application-Code/backend') {
                    sh '''
                trivy image --download-db-only
                trivy fs --skip-db-update . > trivyfs.txt
            '''
                    //sh 'trivy fs . > trivyfs.txt'
                }
            }
        }
Conclusion:
In this project, we have successfully:
- Established IAM user and Terraform for AWS setup.
- Deployed Jenkins on AWS, configured tools, and integrated it with SonarQube.
- Created Jenkins pipelines for CI/CD, deploying a three-tier application.
- Set up an EKS cluster, configured private ECR repositories and Load Balancers.
- Implemented monitoring with Helm, Prometheus, and Grafana.
- Installed and configured ArgoCD for GitOps practices.
Happy Learning!
