

This is an implementation guide to deploying a production-ready web application that can scale from zero to handling thousands of requests. In this comprehensive guide, I’ll walk you through deploying a Plant Identifier application on Google Kubernetes Engine including the use of Ingress, ESO (External Secrets Operator), alongside a setup of monitoring stack.
Introduction
This is an implementation guide to deploying a production-ready web application that can scale from zero to handling thousands of requests. In this comprehensive guide, I’ll walk you through deploying a Plant Identifier application on Google Kubernetes Engine including the use of Ingress, ESO (External Secrets Operator), alongside a setup of monitoring stack.
        graph TB
            subgraph Client["Client"]
                A[User Browser]:::client
            end

            subgraph GCP["GCP"]
                subgraph LB["Google Cloud Load Balancer"]
                    B[GKE Ingress]:::gcp
                    C[Managed Certificate/SSL]:::gcp
                end

                subgraph GKE["GKE Cluster"]
                    subgraph Monitor["Monitoring"]
                        D[Prometheus]:::monitoring
                        E[Grafana]:::monitoring
                        F[ServiceMonitor]:::monitoring
                    end

                    subgraph App["Plant-ID"]
                        G[Plant Identifier App]:::app
                        H[Service Account]:::k8s
                        I[ClusterRole Binding]:::k8s
                    end

                    subgraph Secrets["External-Secrets"]
                        J[External Secrets Operator]:::k8s
                    end
                end
            end

            subgraph AWS["AWS Cloud"]
                K[Secrets Manager]:::aws
            end

            A --> B
            B --> C
            B --> G
            G --> F
            F --> D
            D --> E
            J --> K
            J --> G
            H --> I
            I --> G

            classDef client fill:#1E88E5,stroke:#0D47A1,stroke-width:4px,color:white;
            classDef gcp fill:#4285F4,stroke:#1B5E20,stroke-width:4px,color:white;
            classDef aws fill:#FF9900,stroke:#E65100,stroke-width:4px,color:black;
            classDef k8s fill:#326CE5,stroke:#1A237E,stroke-width:4px,color:white;
            classDef monitoring fill:#33A852,stroke:#1B5E20,stroke-width:4px,color:white;
            classDef app fill:#9C27B0,stroke:#4A148C,stroke-width:4px,color:white;
This project showcases the integration of:
- Google’s Gemini AI for plant identification (the use of API KEY in our .env)
- Google Cloud Platform (GCP) for infrastructure
- Kubernetes (GKE) for container orchestration
- AWS Secrets Manager for secure secret store
- Prometheus and Grafana for monitoring
This setup demonstrates several important concepts in modern web development:
- HPA (HorizontalPodAutoscaler) – Kubernetes deployment
- Cloud-native security practices
- Multi-cloud integration (GCP + AWS)
- Automated SSL certificate management
- Real-time monitoring
For the plant identifier App, it has to run on https for the following reasons:
- Camera access for plant photos
- API calls to Google Gemini
- User trust and security
What We’ll Cover
- Containerizing the application
- Managing secrets securely
- Deploying to GKE
- Configuring HTTPS and domain
- Implementing monitoring
- Testing and validation
Required Accounts & Permissions
Google Cloud Account
- Billing enabled
- Project created
AWS Account (for Secrets Management)
- AWS Access Key ID
- AWS Secret Access Key
- Appropriate IAM permissions for Secrets Manager
Let’s get started!
Prerequisites
- Familiarity with Docker and Kubernetes concepts
- GCP and AWS accounts
- Docker
- AWS cli
- Google Cloud SDK (Download and install from: https://cloud.google.com/sdk/docs/install)
- Command-line tools (gcloud, kubectl, helm)
- GKE gcloud auth plugin (gcloud components install gke-gcloud-auth-plugin)
- A registered domain name
- Required APIs & Services – Enable required GCP APIs
gcloud services enable \
container.googleapis.com \
compute.googleapis.com \
containerregistry.googleapis.com - Domain & DNS
Requirements:- Registered domain name
- Access to domain’s DNS settings
- Access to Add/modify A records (to be mapped to our Ingress static IP)
Step 1: GCP Authentication
gcloud auth login
gcloud config set project PROJECT_ID
Verify APIs are enabled
gcloud services list –enabled
Configure Docker to use GCP Container Registry
For specific region (recommended): gcloud auth configure-docker gcr.io
Step 2: Prepare Docker
We will build our docker image and push it to Google Container Registry.
Download the Application code from my GitHub repo here. By the way I wrote the Plant Identifier App code with the help of Claude Sonnet, and it turned out fine *yay*.
Build your image:
docker build -t gcr.io/YOUR_PROJECT_ID/plant-identifier:latest_1 .
You can get your PROJECT_ID from Google Cloud Console or run “gcloud info | grep Project”.
Push to GCR:
docker push gcr.io/YOUR_PROJECT_ID/plant-identifier:latest_1
Step 3: Reserve a static IP
Provision a Public static IP, we will be using this in our deployment later on.
gcloud compute addresses create plant-id-ip --global
Get the IP address:
gcloud compute addresses describe plant-id-ip --global --format='get(address)'
List all addresses:
gcloud compute addresses list
Step 4: Create cluster
Now let us create our GKE Cluster, I am going with a cost-effective approach as the App is lightweight but we will also configure HPA to allow for scaling if traffic grows, run the below command:
gcloud container clusters create plant-identifier-cluster \
--zone europe-west2-a \
--num-nodes 2 \
--machine-type e2-standard-4 \
--disk-size 30
Get credentials for kubectl:
gcloud container clusters get-credentials plant-identifier-cluster --zone europe-west2-a
Now you can run kubectl commands and check our clusters and resources.
kubectl cluster-info
kubectl get nodes

Also visit the Console to check all the provisioned resources.
STEP 5: Setup External Secrets Operator
We need to create secret for our API Key. If you want to use this application for yourself, you will need a Google Gemini API Key, you can check outside of this document on how to get it, then use the API key you have copied in your .env and also follow the steps below. Remember not to commit your key or any sensitive data to you repository.
In this setup guide, we are going to use AWS Secrets Manager with our GKE cluster to securely store our key (Note that there are many other approaches to doing this, you can make use of other Vaults and you can also directly set it as secret in your pipeline, for example in Jenkins, GitHub etc).
This step involves setting up the External Secrets Operator (ESO) to fetch secrets from AWS Secrets Manager.
First, install the External Secrets Operator:
- Add the External Secrets helm repository
helm repo add external-secrets https://charts.external-secrets.io
helm repo update
2. Install External Secrets Operator
helm install external-secrets \
external-secrets/external-secrets \
--namespace external-secrets \
--create-namespace
3. Verify ESO installation
kubectl get pods -n external-secrets
kubectl get crds | grep externalsecrets

4. Create IAM User/Policy/Role in AWS:
4a. Create policy for Secrets Manager access
aws iam create-policy --policy-name plant-id-secrets-policy --policy-document '{
"Version": "2012-10-17",
"Statement": [
{
"Effect": "Allow",
"Action": [
"secretsmanager:GetSecretValue",
"secretsmanager:DescribeSecret"
],
"Resource": "arn:aws:secretsmanager:::secret:*"
}
]
}'
For example: “Resource”: “arn:aws:secretsmanager:us-east-1::secret:plant-id*”
4b. Create IAM user and attach policy
aws iam create-user --user-name plant-id-secrets-user
4c. Attach Policy to the user
aws iam attach-user-policy --user-name plant-id-secrets-user --policy-arn
For example: aws iam attach-user-policy –user-name plant-id-secrets-user –policy-arn arn:aws:iam:::policy/plant-id-secrets-policy
It is always advised to apply principle of least privilege, avoid granting broad permissions, however, in a case of local development or you are working alone, you can also use the below AWS policy:
aws iam attach-user-policy --user-name plant-id-secrets-user --policy-arn arn:aws:iam::aws:policy/SecretsManagerReadWrite
4d. You can list the attached policy for the user as below:
aws iam list-attached-user-policies --user-name plant-id-secrets-user
5. Create access keys and save the details
aws iam create-access-key --user-name plant-id-secrets-user
6. Store secret in AWS Secrets Manager
Run the below command to store your secret:
aws secretsmanager create-secret \
--name plant-id \
--secret-string '{"GOOGLE_API_KEY":"your-api-key-value"}'
Create namespace
Before we continue, let us create a namespace where we deploy our resources.
kubectl create namespace plant-id
7. Configure AWS Credentials
#Create AWS credentials secret
kubectl apply -f - <<EOF
apiVersion: v1
kind: Secret
metadata:
  name: aws-credentials
  namespace: plant-id
type: Opaque
stringData:
  access-key-id: YOUR_AWS_ACCESS_KEY_ID
  secret-access-key: YOUR_AWS_SECRET_ACCESS_KEY
EOF
Verify secret creation:
kubectl get secret aws-credentials
8. Configure SecretStore
Let’s configure SecretStore, note that you can configure it globally using kind: ClusterSecretStore instead of limiting it to a particular namespace.
secretStore-auth.yaml
apiVersion: external-secrets.io/v1beta1
kind: SecretStore
metadata:
  name: aws-secret-store
  namespace: plant-id
spec:
  provider:
    aws:
      service: SecretsManager
      region: us-east-1
      auth:
        secretRef:
          accessKeyIDSecretRef:
            name: aws-credentials
            key: access-key-id
            namespace: plant-id
          secretAccessKeySecretRef:
            name: aws-credentials
            key: secret-access-key
            namespace: plant-id
kubectl apply -f secretStore-auth.yaml
Verify SecretStore:
kubectl get secretstore
kubectl describe secretstore aws-secret-store
- Configure ExternalSecret
# external-secrets.yaml
apiVersion: external-secrets.io/v1beta1
kind: ExternalSecret
metadata:
  name: plant-id-external-secret
  namespace: plant-id
spec:
  refreshInterval: 1h
  secretStoreRef:
    name: aws-secret-store
    kind: SecretStore
  target:
    name: plant-id-secrets
    creationPolicy: Owner
  data:
  - secretKey: GOOGLE_API_KEY
    remoteRef:
      key: plant-id
      property: GOOGLE_API_KEY
kubectl apply -f external-secrets.yaml
Verify ExternalSecret:
kubectl get externalsecret
kubectl describe externalsecret plant-id-external-secret

STEP 6: Deploy to GKE
Points to note:
- Managed certificates for SSL
- Proper NEG annotations
- Service with NEG annotations
- GKE HTTP(S) Load Balancing enabled
- Domain configuration
- DNS Configuration pointing to Ingress IP
- Deployment with Secrets
Let’s work on deploying our application. Ensure your secretKeyRef:name matches the name given in your target:name in external-secrets.yaml.
If your application is not able to get the API-Key or any other values in your env, the pods will get stuck in some errors.
# deployment.yaml
apiVersion: apps/v1
kind: Deployment
metadata:
  name: plant-identifier
  namespace: plant-id
spec:
  replicas: 1
  selector:
    matchLabels:
      app: plant-identifier
  template:
    metadata:
      labels:
        app: plant-identifier
    spec:
      containers:
      - name: plant-identifier
        image: gcr.io/<project-ID>/plant-identifier:latest_1
        ports:
        - containerPort: 3000
        resources:
          requests:
            cpu: 100m
            memory: 128Mi
          limits:
            cpu: 300m
            memory: 256Mi
        env:
        - name: GOOGLE_API_KEY
          valueFrom:
            secretKeyRef:
              name: plant-id-secrets
              key: GOOGLE_API_KEY
- BackendConfig (GKE-specific)
BackendConfig customizes the behaviour of GCP load balancer backends like the Custom health checks and timeout settings. Here you can also enable CDN, configure session affinity, connection draining and other settings you require, you can refer to Google Cloud documentation for more available options.
# backend-config.yaml
apiVersion: cloud.google.com/v1
kind: BackendConfig
metadata:
  name: plant-id-backend-config
  namespace: plant-id
spec:
  healthCheck:
    checkIntervalSec: 30
    timeoutSec: 5
    healthyThreshold: 1
    unhealthyThreshold: 2
    type: HTTP
    requestPath: /
    port: 3000
After we apply our config file, we can check these:
kubectl get backendconfig -n plant-id
gcloud compute health-checks list
3. Configure Managed Certificate
# managed-cert.yaml
apiVersion: networking.gke.io/v1
kind: ManagedCertificate
metadata:
  name: plant-id-cert
  namespace: plant-id
spec:
  domains:
  - <your-domain-name>
Verification commands:
kubectl get managedcertificate -n plant-id
kubectl describe managedcertificate plant-id-cert -n plant-id
Check certificate status in GCP:
gcloud compute ssl-certificates list
For example, you will see an output like this:
$ gcloud compute ssl-certificates list
NAME TYPE CREATION_TIMESTAMP EXPIRE_TIME REGION MANAGED_STATUS
mcrt-7cde66e0-56bd-460c-85c0-230d1b849716 MANAGED 2024-11-09T04:51:42.750-08:00 2025-02-07T04:51:44.000-08:00 ACTIVE
projectrom.co.uk: ACTIVE
You need to give 10 to 30 minutes for the ssl certificate to become ACTIVE. If it is however stuck in PROVISIONING state as below, check your DNS mapping, managed certificate configuration, check status of the DNS records and your domain.
NAME TYPE CREATION_TIMESTAMP EXPIRE_TIME REGION MANAGED_STATUS
mcrt-c0e796a1-28df-4567-9ef5-d0b7d1cae948 MANAGED 2024-11-12T04:32:55.344-08:00 PROVISIONING
projectrom.co.uk: PROVISIONING
4. Horizontal Pod Autoscaling (HPA)
The HPA automatically scales the number of pods based on resource utilization or custom metrics. Some of the benefits of this are cost optimization, improved application performance, customized thresholds, resource efficiency and improved application performance.
Let’s add HPA config.
# hpa.yaml
apiVersion: autoscaling/v2
kind: HorizontalPodAutoscaler
metadata:
  name: plant-identifier-hpa
  namespace: plant-id
spec:
  scaleTargetRef:
    apiVersion: apps/v1
    kind: Deployment
    name: plant-identifier
  minReplicas: 1
  maxReplicas: 3
  metrics:
  - type: Resource
    resource:
      name: cpu
      target:
        type: Utilization
        averageUtilization: 70
To verify hpa status:
kubectl get hpa -n plant-id
kubectl describe hpa plant-identifier-hpa -n plant-id
5. Configure Service
Lets configure our Service and add some annotations.
# service.yaml
apiVersion: v1
kind: Service
metadata:
  name: plant-identifier
  namespace: plant-id
  annotations:
    cloud.google.com/neg: '{"ingress": true}'
    cloud.google.com/app-protocols: '{"http":"HTTPS"}'
    cloud.google.com/backend-config: '{"default": "plant-id-backend-config"}'
spec:
  type: ClusterIP
  ports:
  - port: 80
    targetPort: 3000
  selector:
    app: plant-identifier
Verify Status:
kubectl get service plant-identifier -n plant-id
kubectl describe service plant-identifier -n plant-id
A quick check of the BackendConfig:
kubectl describe backendconfig plant-id-backend-config -n plant-id
After applying the config, you should see outputs similar to these:


6. FrontendConfig
FrontendConfig customizes the Google Cloud Load Balancer’s frontend settings. We will be associating it with our Ingress later on, using annotation. Here, we can enable HTTPS redirection, configure SSL policies, configure appropriate security headers and other options available. Consult the Google Cloud documentation for more customizable features.
# frontend-config.yaml
apiVersion: networking.gke.io/v1beta1
kind: FrontendConfig
metadata:
  name: plant-id-https
  namespace: plant-id
spec:
  redirectToHttps:
    enabled: true
    responseCodeName: MOVED_PERMANENTLY_DEFAULT # 301 redirect
  sslPolicy: gke-ingress-ssl-policy
If you want to apply FrontendConfig if in a separate file:
kubectl apply -f frontend-config.yaml
Check status:
kubectl get frontendconfig -n plant-id
kubectl describe frontendconfig plant-id-https -n plant-id
7. Apply Deployment file
I have put all the configuration in one file, let us apply it:
kubectl apply -f deployment-frontend.yaml
Verify deployment:
kubectl get deployments -n plant-id
kubectl describe deployment plant-identifier -n plant-id
kubectl get pods -n plant-id
kubectl describe pod -l app=plant-identifier -n plant-id


Let us check the managed certificate as well.

Let’s check our HPA as well:

8. Configure Ingress
Let us expose our Kubernetes App using Ingress-gce. This will help with load balancing and redirect HTTP traffic to HTTPS.
# ingress.yaml
apiVersion: networking.k8s.io/v1
kind: Ingress
metadata:
  name: plant-id-ingress
  namespace: plant-id
  annotations:
    kubernetes.io/ingress.class: "gce"
    networking.gke.io/managed-certificates: "plant-id-cert"
    kubernetes.io/ingress.global-static-ip-name: "plant-id-ip" # If using static IP
    networking.gke.io/v1beta1.FrontendConfig: "plant-id-https"
spec:
  rules:
  - host: xxxpom.co.uk  # Replace with your domain
    http:
      paths:
      - path: /
        pathType: Prefix
        backend:
          service:
            name: plant-identifier
            port:
              number: 80
Apply the config:
kubectl apply -f ingress.yaml
Validate:
kubectl get ingress -n plant-id
kubectl describe ingress plant-id-ingress -n plant-id

gcloud compute forwarding-rules list

Health check status:
gcloud compute health-checks list

kubectl get apiservice v1beta1.metrics.k8s.io -o yaml #verify metrics server
Check BE and NEGs
gcloud compute network-endpoint-groups list


Check all the deployed services
kubectl get all -n plant-id
9. DNS Configuration Verification
You can carry out this step at any point before or after creating Managed Certificate and Ingress. This is just a guide to follow if you need to setup your domain and A records.
Get Ingress IP
kubectl get ingress plant-id-ingress -n plant-id -o jsonpath='{.status.loadBalancer.ingress[0].ip}'
Go to your domain registrar
Add an A record pointing to your static IP:
Type: A
Name: plant-id (or @ for root domain) – I used “@”
Verify DNS resolution:
nslookup <your-domain-name>
Test HTTPS certificate:
curl -v https://<your-domain-name>
Access your domain
Now our App should be reachable, browse to your domain to confirm.

Test the redirect we configured in Frontendconfig
curl -I http://<yourdomain>

It Should show a 301 redirect to https://
Check ingress events
kubectl get events -n plant-id

Check service and application logs
kubectl logs -l app=plant-identifier -n plant-id
View logs for the last hour with timestamps
kubectl logs -l app=plant-identifier -n plant-id --since=1h

$ kubectl logs -l app=plant-identifier -n plant-id --since=40h
{
"name": "Jute",
"description": "Jute is a natural fiber obtained from the stem of the jute plant, Corchorus olitorius.",
"scientificName": "Corchorus olitorius",
"family": "Tiliaceae",
"nativeRegion": "Tropical Asia",
"sunlightNeeds": "Full sun to partial shade",
"wateringFrequency": "Regular watering, keeping soil moist but not soggy"
}
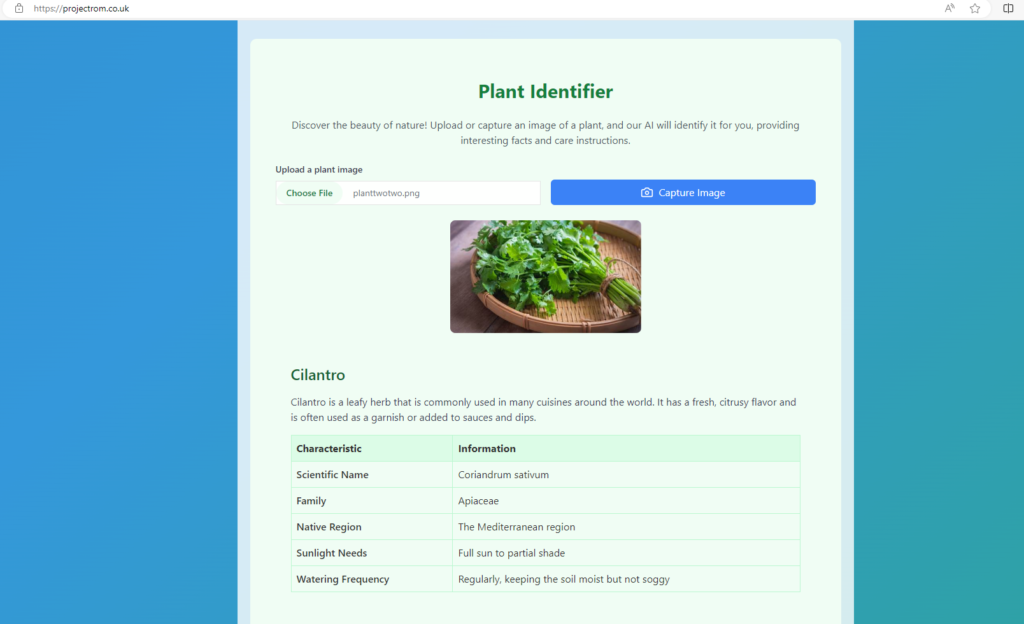
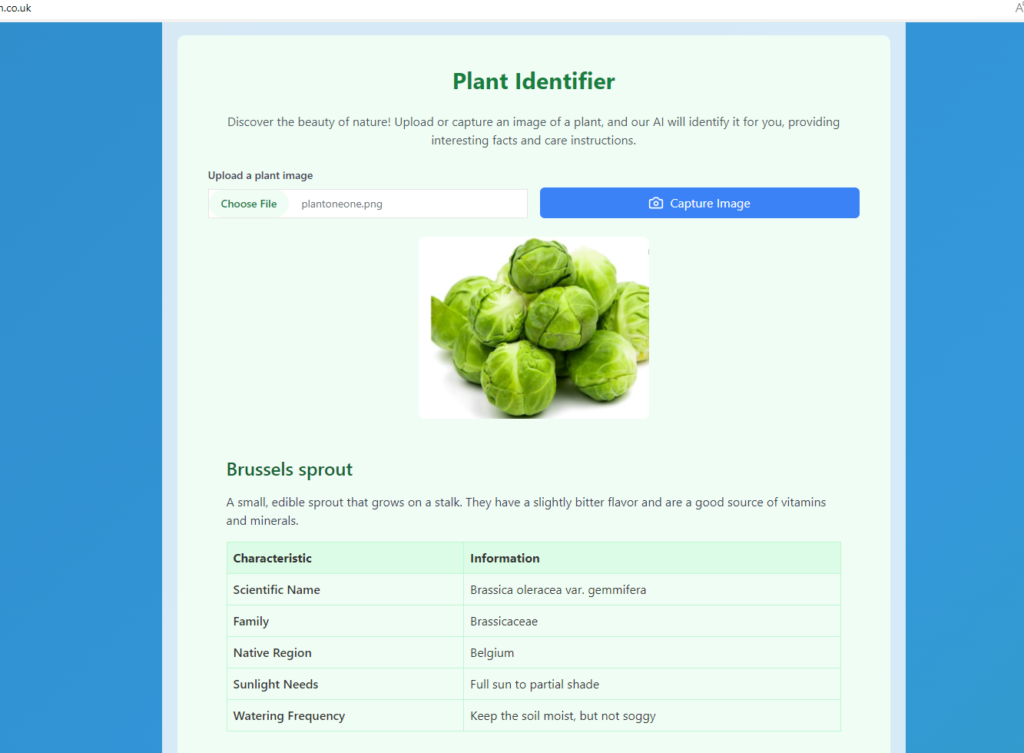
Lastly, let’s play around with the App, download different plant pictures, upload each one for identification by the App, you can also capture image of plant directly if any plant is close to you, image capturing is easier with your phone camera, so browse to your site address and play around with it.
Step 7: Install Prometheus, Grafana and AlertManager
We will be creating easy monitoring with Grafana and Prometheus. Grafana server serves as our dashboard and data source management and it supports multiple data sources including Prometheus, Loki, AWS Cloudwatch, Elasticsearch as data sources.
Using kube-prometheus-stack
Let’s proceed with using kube-prometheus-stack. kube-prometheus-stack is a preconfigured solution to spin up Prometheus quickly.
It involves a pre-configured Prometheus installation that automatically collects metrics from Kubernetes resources (pods, services, storage, etc.). Additionally, the kube-prometheus-stack provides Grafana integration with ready-made dashboards and visualizations.
Add Helm repos
helm repo add prometheus-community https://prometheus-community.github.io/helm-charts
helm repo update
Install kube-prometheus-stack:
This will install Prometheus, Alertmanager, and Grafana, along with several pre-configured dashboards and alerts for Kubernetes monitoring.
Install Helm Chart using values.yaml (Download the prom-stack-values.yaml from my GitHub repo Here) for customization and set the “grafana.adminPassword=?”
helm upgrade --install prom-stack prometheus-community/kube-prometheus-stack -n monitoring --create-namespace -f prom-stack-values.yaml --set grafana.adminPassword="<your-password>"
After installing kube-prometheus-stack Helm chart, we can use the “kubectl get all -n monitoring” commmand to view all its components.
kubectl get all -n monitoring
kubectl --namespace monitoring get pods

Access Grafana
To expose our Grafana, we can:
- Port-forward to access Grafana:
kubectl port-forward svc/kube-prometheus-grafana -n monitoring 3000:80
- You can change svc ClusterIP to LoadBalancer type by editing the file directly.
- You can also pass the option in helm upgrade.
helm upgrade --install prom-stack prometheus-community/kube-prometheus-stack \
--namespace monitoring \
--set prometheus.server.service.type=LoadBalancer
If you notice that in our values file (prom-stack-values.yaml), we have stated LoadBalancer as service type, so for us, no need to change anything.
If you did not set the Grafana admin password in values.yaml file or pass it in helm install command, you can retrieve it by using the below command:
kubectl get secret --namespace monitoring prom-stack-grafana -o jsonpath="{.data.admin-password}" | base64 --decode ; echo
After installing, check the external IP assigned to the Grafana service:
check services –
kubectl get svc -n monitoring
kubectl get svc -n monitoring prom-stack-grafana
kubectl get svc -n monitoring prom-stack-kube-prometheus-prometheus
kubectl get svc -n monitoring prom-stack-kube-prometheus-alertmanager
You can access Grafana at http://<EXTERNAL_IP>:80
You can access Prometheus at http://<EXTERNAL_IP:9090
So that our Prometheus stack can access the resources in our cluster across different namespaces including our Plant-ID App, we need to configure ServiceMonitor and rbac – ClusterRole and ClusterRoleBinding, refer to the GitHub documentation for the files.
Download files from Here
Apply the config files:
kubectl service-monitor.yaml
kubectl apply -f prometheus-rbac.yaml
Let’s check our service monitor:
kubectl get servicemonitor -A
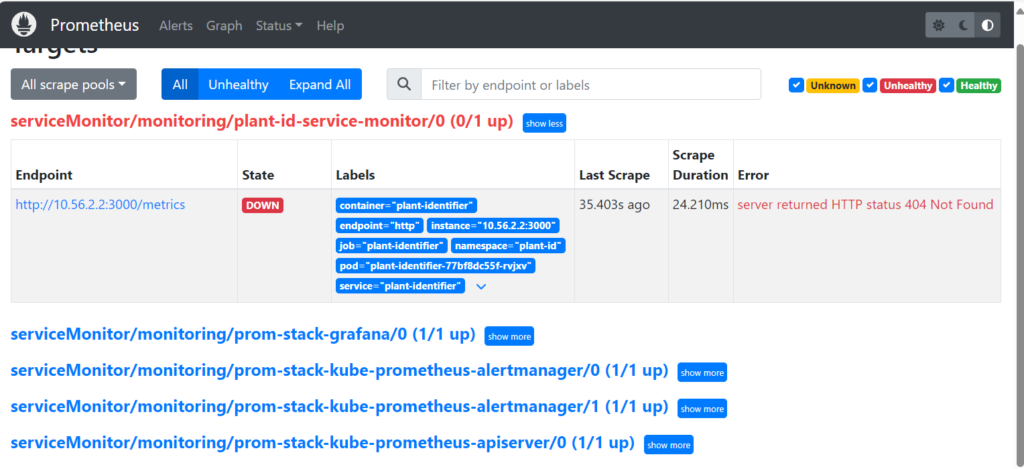
By examining the metric values in the pre-packaged dashboard, we can visually inspect the metric values of all resources in the Kubernetes cluster. Navigate to “Targets” on Prometheus.
A simulated service down scenario:

Dashboards visualization:


If you need to add any other data source, you can go to Connection –> Add new data source –> select your Data source –> Enter key details like URL, Authentication etc –> Test and Save
In our next project, we will delve deeper into configuring AlertManager, Grafana Loki for log aggregation and Grafana for visualization.
A few tips If you need to delete resources you have used
helm list -A
Delete Prometheus Stack
helm uninstall prom-stack -n monitoring
Delete namespace
kubectl delete namespace monitoring
kubectl delete namespace plant-id
Delete IP and certs:
gcloud compute addresses delete plant-id-ip --global
gcloud compute ssl-certificates list
gcloud compute ssl-certificates delete [CERT_NAME] --global
List node pools
gcloud container node-pools list \
--cluster plant-identifier-cluster \
--zone europe-west2-a
Delete node pools
gcloud container node-pools delete default-pool \
--cluster plant-identifier-cluster \
--zone europe-west2-a
List and delete disks
gcloud compute disks list
gcloud compute disks delete DISK_NAME --zone europe-west2-a
Delete persistent volumes
kubectl delete pv --all
Delete cluster
gcloud container clusters delete plant-identifier-cluster \
--zone europe-west2-a \
--async
Conclusion
The Plant Identifier application deployment showcases a secure, cloud-native deployment on GKE with AWS Secrets Manager, Prometheus, and Grafana, highlighting robust multi-cloud integration and DevOps best practices. This setup includes automated SSL/TLS management, secure secret handling via External Secrets Operator, and scalable, well-configured infrastructure for high performance and maintainability.
Happy Learning!